
Have you ever tried predicting your next exam score based on how many hours you studied? Or maybe you noticed that the warmer the temperature gets outside, the more ice cream sales skyrocket. Humans are naturally great at spotting these kinds of patterns. But how do computers make these predictions automatically?
That is where Linear Regression comes in! Linear regression is one of the foundational building blocks of machine learning and artificial intelligence. It takes data points from the past, finds the hidden connection between them, and uses that trend to predict what will happen in the future. Whether it is predicting video game sales, forecasting the weather, or estimating house prices, linear regression is the secret math engine behind it all.
How Linear Regression Works
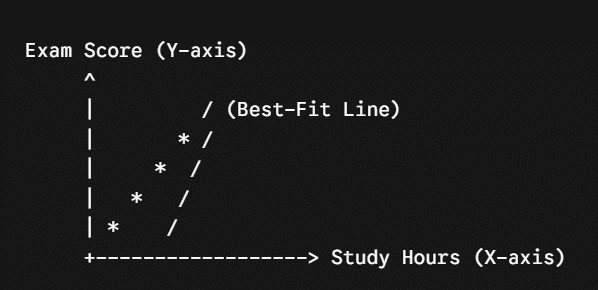
- Plotting the Data (Finding the Scatter Plot)Imagine you collect data from your friends about how many hours they studied for a test and the test scores they received. If you plot these on a graph, with study hours along the bottom (the X-axis) and test scores going up the side (the Y-axis), you get a cluster of points called a scatter plot.
- Drawing the Line of Best FitLinear regression looks at all those scattered points and tries to draw a single, straight line right through the middle of them. This is called the line of best fit. The goal of the algorithm is to position this line so that it is as close to every single point as possible, minimizing the distance between the line and the actual data points.
- The Magic EquationYou might recognize this line equation from math class:
Y = mX + c
- Y is the predicted result (e.g., your test score).
- X is the input value (e.g., how many hours you studied).
- m is the slope of the line (how steep it goes up or down).
- c is the starting point (where the line crosses the Y-axis).
Once the computer calculates the best values for m and c, you have a working prediction machine!
Try It Yourself: The Ice Cream Predictor
Imagine you are running an ice cream truck and want to predict sales based on the daily temperature forecast.
Data Collected:
- Day 1: 20°C -> 100 ice creams sold
- Day 2: 25°C -> 150 ice creams sold
- Day 3: 30°C -> 200 ice creams sold
Notice the pattern? For every 5°C increase in temperature, ice cream sales increase by 50!
Your Challenge:
- Using the pattern above, if tomorrow’s temperature is forecasted to be 35°C, how many ice creams should you expect to sell?
- What if a heatwave hits and the temperature reaches 40°C?
(Answer: For 35°C, you would expect to sell 250 ice creams. For 40°C, you would expect to sell 300!)
Quick Summary & Key Takeaways
- Linear regression is a machine learning method used to predict future numerical outcomes based on historical data.
- It finds relationships between variables by drawing a straight “line of best fit” through data points on a graph.
- The mathematical formula Y = mX + c powers the prediction line, calculating the slope and starting value automatically.
- It is widely used across technology, finance, science, and gaming to spot trends and make accurate forecasts.
 ) to enable essential functionality. Click "I accept" if you are okay with that! :)